The instructor dashboard is a key component of the ITS application as it provides you feedback on the most important aspects of your students’ performance for a module. It provides general metrics like how many questions each student answered, whether they were able to complete the module, and how much time they spent. More importantly it presents aggregate information about common mistakes or confusions that students encountered.
Watch this video for a walkthrough of the dashboard.
Navigating the Dashboard
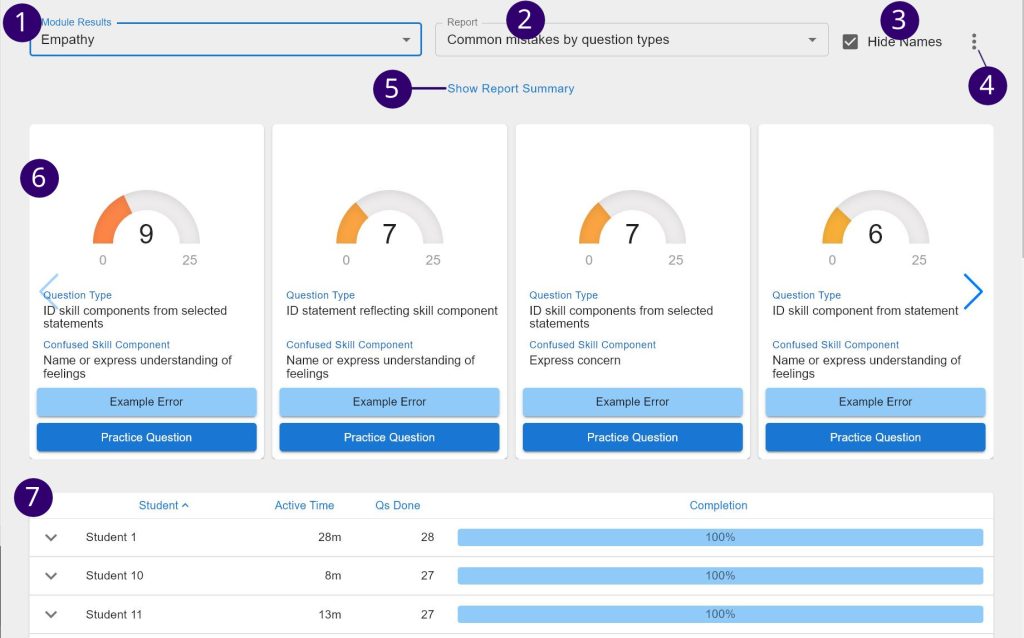
- Module Selector: The module to view student performance on
- Report Card Type: Change the category of mistake/misunderstanding that is currently displayed as report cards. The types are Common mistakes by question types and Common confusions between components
- Hide Names: Check to anonymize the student names that are displayed (useful when sharing your screen with the class). Uncheck to view the real student names.
- Settings:
- Refresh Results: Manually reload student result data
- Card Settings: Adjust thresholds for cards
- Act as Student: Change to student viewpoint to view the module questions
- Open Tour: View a guided tutorial on elements of the dashboard
- Create Student Link: If using the standalone/non-canvas version of ITS, this creates a link to ITS that can be included in emails or course website
- Light Mode: Toggle background color between light and dark
- Report Cards: Collection of cards where each one is a summary of a common mistake or confusion
- Student Statistics Table: View metrics for individual students
- Click the down arrow to view full question response history
- Time student spent on module with idle time pruned out
- Number of questions attempted
- Percentage of the module completed